About DE-9IM Visualizer
What is DE-9IM?
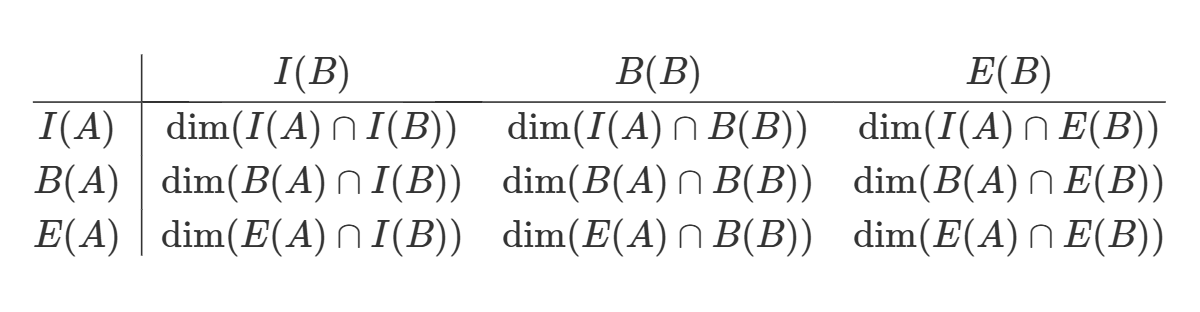
The Dimensionally Extended Nine-Intersection Model (DE-9IM) is a way to describe how two geometries (points, lines, polygons) relate in space. It looks at the intersections between each object's interior, boundary, and exterior, resulting in a 3×3 matrix.
Visualization and why it helps
Reading DE-9IM as raw codes like FF2F11212 can be confusing. This visualizer lets you drag and drop shapes on the canvas and directly see how the relation matrix changes. Each relation is also explained in plain English below its matrix.
Only unique pairs are shown, such as A×B instead of both A×B and B×A. Mathematically, A×B is the transpose of B×A, so showing both would repeat the same information.
Why this was made
This is a basic tool created for fun and learning. While exploring DE-9IM I wanted to find a visualizer, but since I couldn't, I decided to make this simple version myself.
Credits
This project was built with help from existing open-source libraries:
- React-Konva for drawing and dragging shapes.
- JSTS for geometry and relation logic. JSTS is a JavaScript port of the Java Topology Suite (JTS), the library behind many GIS tools.
GitHub
Source code: GitHub Repository
Feedback
You can reach me via my contact page.
23/09/2025